When we moved into our new house, I wanted to know if our kid’s rooms were consistent with the average temperature of the house. After all, sleep temperature can significantly impact sleep quality – and we all want our kids to sleep well! So I bought a couple of IoT (internet of things) connected thermometers so I could track their room temperatures and watch the data.
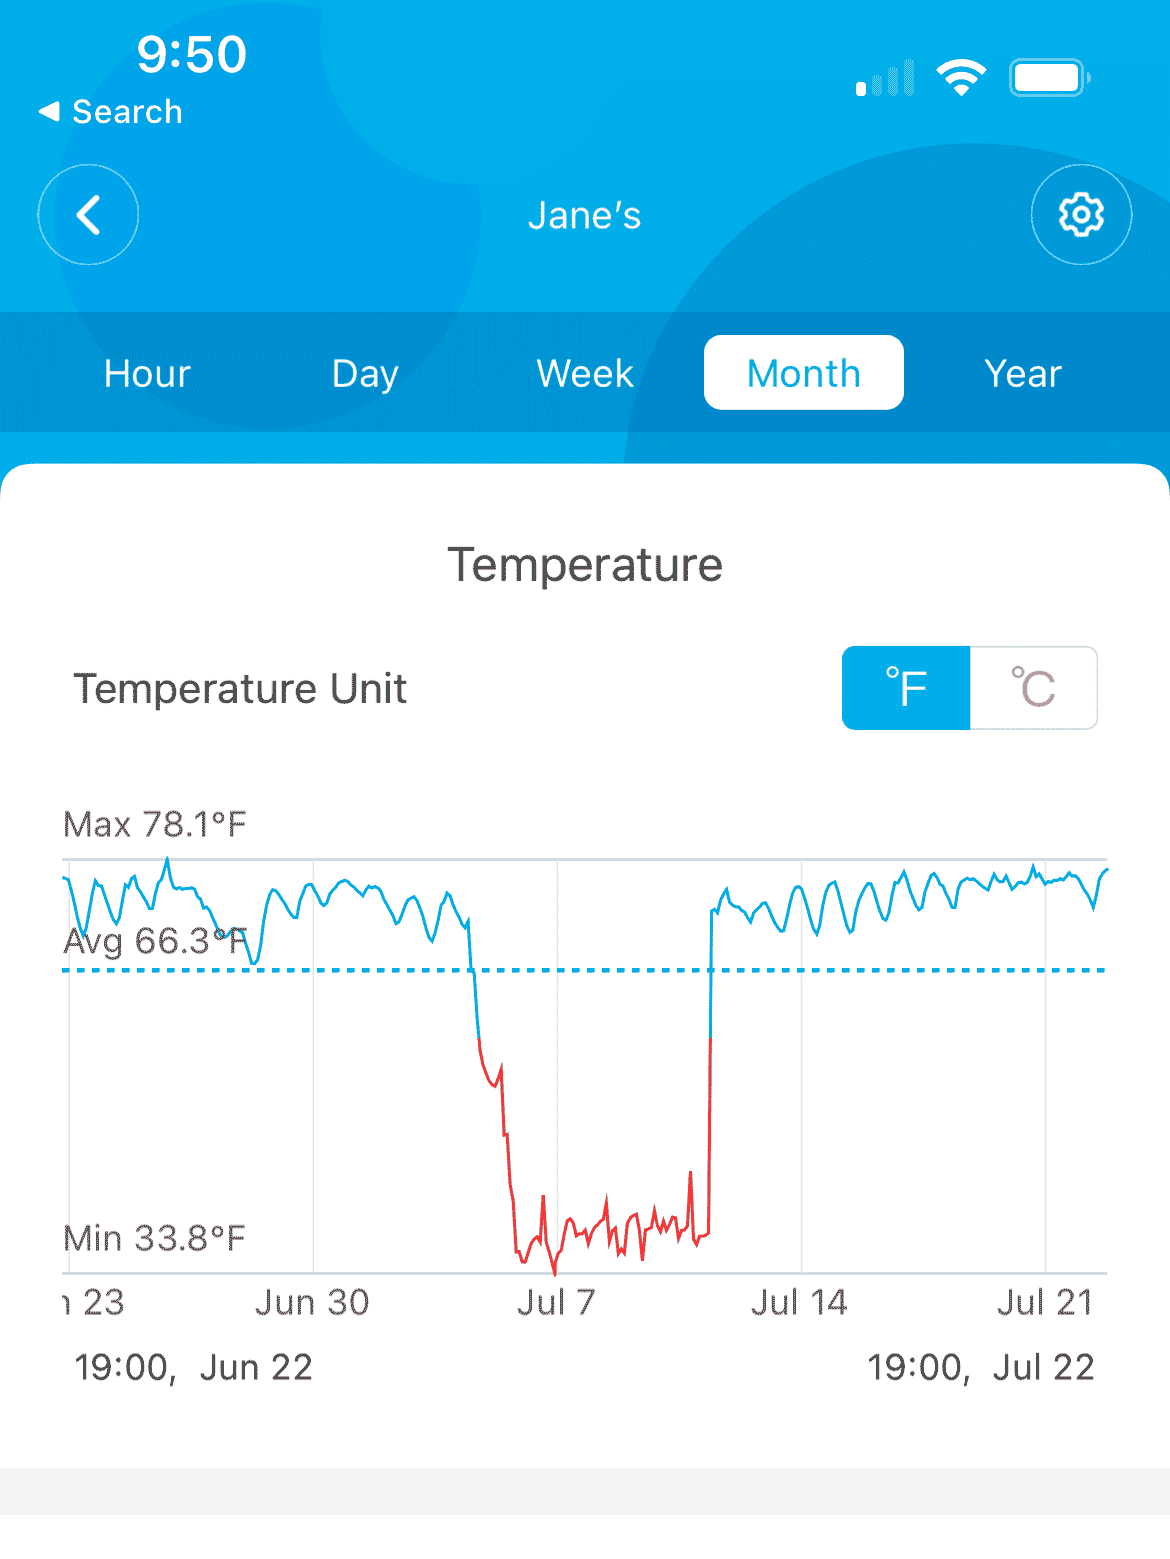
Then one day in July, I loaded up the temperature graphs and saw this:

The temperature in her room had dropped down to 33 degrees. What in the world was happening!?
Of course, I am leaving some critical details out of the story – but the data and facts don’t lie, right? If you were an investigator, who only had access to the data, you wouldn’t have the whole story. How would you make sense of the graph?
The real story: Over the 4th of July weekend, our freezer went on the fritz and completely frosted its rear vents, causing our fridge to lose its cool. Instead of guessing the temperature inside, I moved the room sensors from the kid’s rooms into the refrigerator and freezer to keep track of what was happening. The fridge/freezer data was invaluable for monitoring the issue, but it significantly altered our room temperature information.
Data can’t tell the entire story.
Sign Up to Get Our Latest Posts Tuesdays and Thursdays
No Spam, Period. Just the latest posts.
Sometimes you need context to make sense of what happened. If you were a data analyst, you would have no idea how the room temperature anomaly occurred without speculating. You might even see the temperature range and guess it looked a lot like reading from a refrigerator, but you wouldn’t know how this came to be for a sensor placed in a child’s room.
The same is valid for data in your business; the numbers alone don’t always tell the whole story.
Perhaps your sales numbers dropped far more than expected on a seasonal basis – do you know the real story why? Or your Analytics data shows a significant spike in traffic from a geographic region – do you know the real story why?
The numbers are helpful to have, but on their own, they are missing key details that provide context. By all means, capture as much data as possible, but also work on discovering the full, authentic, complete story.
Takeaways:
- Capture data! But accept that it often cannot tell the entire story.
- Find vendors skilled at uncovering and telling the whole story, not just sharing confusing bulk data.
- Do not only track data but the less concrete happenings in the world and around your business – that will help make sense of a sudden dip in your room temperature when you look back and see a peculiarity in your data!


